


Tampa Florida Industrial Real Estate Activity
At Bounat we work regularly to compile a comprehensive list of the most significant industrial commercial real estate activity, focusing heavily on construction projects and industrial real estate sales taking place each quarter in Tampa, Florida.
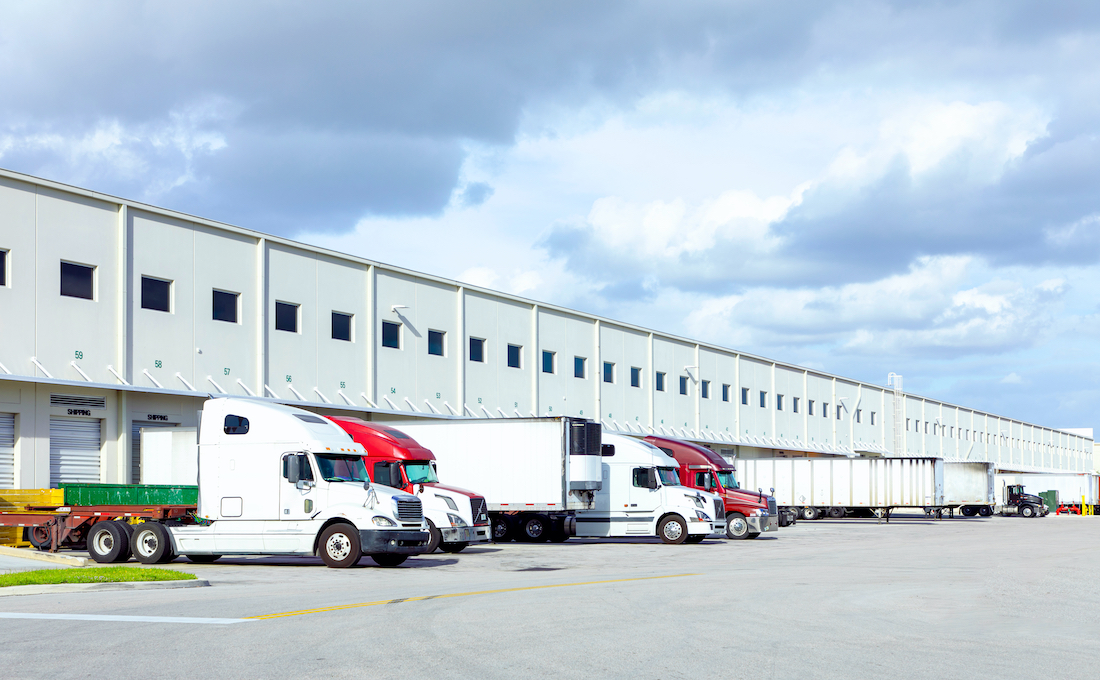
Tampa’s industrial market has experienced significant growth over the past few years, marked by brisk leasing activity, historic rates of net absorption, and strong rent growth. Its geographic advantages are apparent, as well. Sitting in the central part of Florida and along the waters of the Gulf of Mexico, Tampa makes for a great transportation hub of goods and materials coming in and out of the country for not only national, but international markets as well.
Below we go over several important statistics of industrial real estate in Tampa, FL.
Tampa Industrial Real Estate Stats and Updates Q2 2026
Industrial fundamentals in the Tampa market have softened over the past year. The market’s vacancy rate has risen considerably, driven by a combination of new construction completions and negative absorption.
Rising vacancy and competition from both new construction and existing product have dampened landlords’ ability to push rents, with annual asking rent growth at a decade-low. While the construction pipeline is below recent peaks, it remains well above the 2015–2019 annual average.
Market participants indicate that economic uncertainty is having a greater influence on leasing decisions than in recent years. Tenant and investor decision-making has slowed, especially compared to the peak activity seen between 2021 and 2023.
These dynamics are now clearer in market fundamentals. Overall, the market has recorded 150,000 SF of absorption over the past year, while new supply additions have also pushed vacancy higher. As a result, Tampa’s vacancy rate has risen to 8.3%, a 15-year high.
Unlike prior periods over the past five years, the current negative absorption cannot be attributed to just one or two large tenant move-outs. Now, tenant vacancies are more widespread, with 100,000-SF or larger buildings built before 2010 experiencing significant occupancy losses over the past year. In addition, small-bay buildings, those under 100,000 SF, have recorded negative absorption over the trailing 12-month period.
The softened demand backdrop and higher vacancy rate have reduced landlords’ pricing power. Overall, asking rents are up just 0.8% year-over-year in Tampa to $12.80/SF, a marked slowdown from the stronger annual gains seen just a year ago. Many tenants, particularly local and regional firms, are now facing sticker shock upon renewal, as rents have climbed roughly 50% over the past five years.
Developers have responded to the changing leasing environment by pulling back on new projects and favoring smaller buildings. Roughly 2.5 million SF is under construction, of which about 60% is unleased speculative development.
The makeup of the pipeline has changed. The largest speculative building currently underway is just 200,000 SF, as small-bay spaces now dominate new construction. While the small bay sector, spaces under 50,000 SF, has outperformed big box leasing, it has seen a softening over the past year.
Moving forward, Tampa’s industrial vacancy rate is likely to remain elevated, and rent growth is expected to remain subdued until tenant demand is more consistent and the market works through available speculative space. While developers have pulled back on new starts, broader tenant caution and more widespread move-outs suggest the recovery in fundamentals could be gradual.
You can view our commercial properties in Florida to see what real estate assets are available for lease/sale.
Tampa Industrial Projects Under Construction Stats in Q2 2026
Tampa Industrial Projects Under Construction Stats in Q2 2026
Tampa’s construction pipeline is shifting back to historic norms as the number of build-to-suits fades. As the market approaches 2027, less than 750,000 SF of the market’s 3.0 million SF currently under construction is being built to suit.
- Total Properties Under Construction: 33
- Total Square Feet Under Construction: 2.52M
- Percent of Inventory Represented: 1.2%
- Preleased Property Space: 28.7%
Top 10 Tampa Industrial Projects Under Construction in Q2 2026
1) North Tampa 75 – Building 2… (7500 Old Pasco Rd)
Rating: 4*
Building SF: 301,600
Stories: 1
Start: May 2026
Complete: Jun 2027
Developer: – Rooker Co.
Owner: Rooker Co.
2) North Tampa 75 – Building 4… (7500 Old Pasco Rd)
Rating: 4*
Building SF: 205,380
Stories: 1
Start: Jan 2026
Complete: Jan 2027
Developer: – Rooker Co.
Owner: Rooker Co.
3) Lakeview Industrial Park (6705 Lakeview Center Dr)
Rating: 4*
Building SF: 203,320
Stories: 1
Start: Sep 2026
Complete: Nov 2028
Developer: Richland Communities, Inc.
Owner: Richland Communities, Inc.
4) Bullseye Logistics Building (540-558 S Falkenburg Rd)
Rating: 4*
Building SF: 175,732
Stories: 1
Start: Jun 2026
Complete: Mar 2027
Developer: ARCO/Murray
Owner: Crow Holdings Capital
5) Bullseye Logistics Building (504-520 S Falkenburg Rd)
Rating: 4*
Building SF: 175,732
Stories: 1
Start: Jun 2026
Complete: Mar 2027
Developer: ARCO/Murray
Owner: Crow Holdings Capital
6) Building 3 West Site (10411 US 92)
Rating: 4*
Building SF: 156,495
Stories: 1
Start: Jan 2026
Complete: Oct 2026
Developer: Not Listed
Owner: EastGroup Properties, Inc.
7) Causeway Logistics (3602 Causeway Blvd)
Rating: 4*
Building SF: 143,100
Stories: 1
Start: Nov 2025
Complete: Oct 2026
Developer: Hazel Street Capital LLC
Owner: Hazel Street Industrial
8) New Tampa Business Center (9447 E Fowler Ave)
Rating: 4*
Building SF: 136,714
Stories: 1
Start: May 2026
Complete: Mar 2027
Developer: Not Listed
Owner: Trammell Crow Company
9) Causeway Logistics (3600 Causeway Blvd)
Rating: 4*
Building SF: 109,920
Stories: 1
Start: Nov 2025
Complete: Oct 2026
Developer: Hazel Street Capital LLC
Owner: Hazel Street Industrial
10) Lakeview Industrial Park (6704 Lakeview Center Dr)
Rating: 4*
Building SF: 106,375
Stories: 1
Start: Sep 2026
Complete: Nov 2028
Developer: Richland Communities, Inc.
Owner: Richland Communities, Inc.
Tampa Industrial Real Estate Stats and Top 5 Industrial Property Sales Q2 2026
The Tampa industrial market has surpassed $150 million in quarterly sales volume for seven consecutive quarters. While current levels are well below what the market recorded in 2021 and 2022, it is far above pre-pandemic norms. The trailing 12-month sales volume is $880 million.
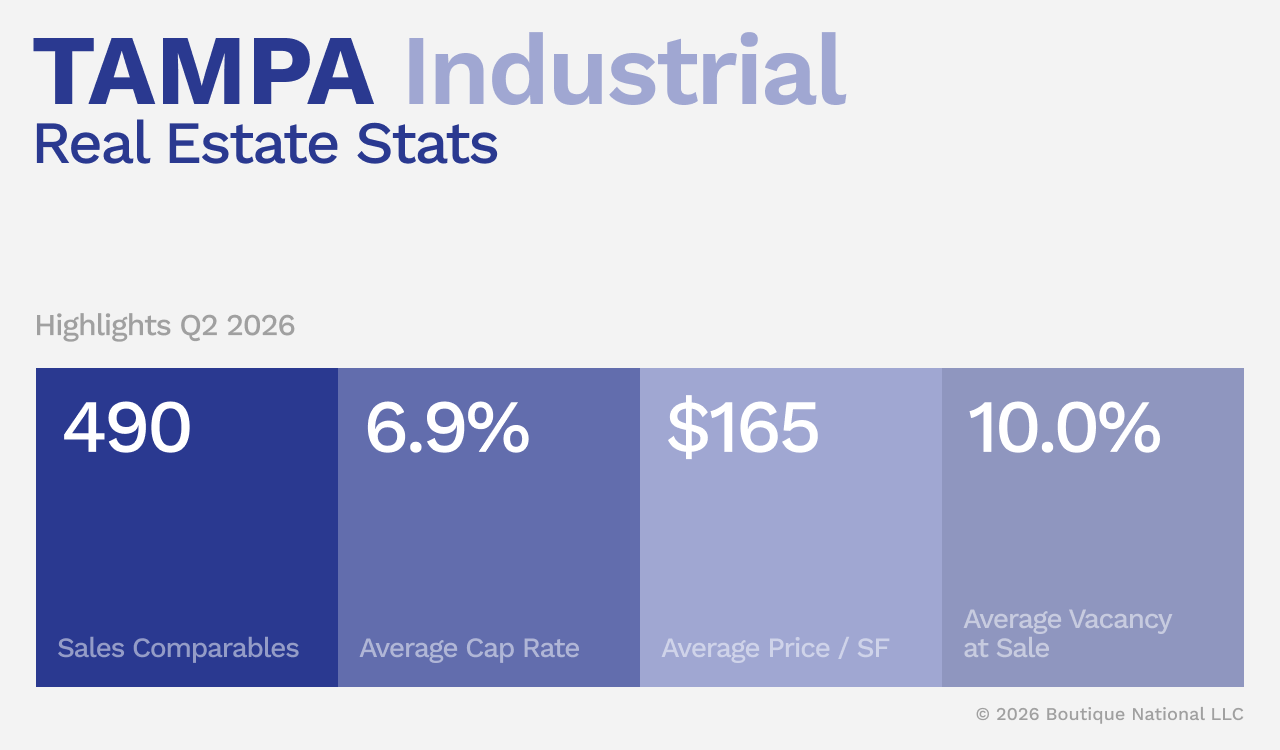
- Sales Comparables: 490
- Average Cap Rate: 6.9%
- Average Price/ SF: $165
- Average Vacancy at Sale: 10.0%
Tampa Industrial Real Estate Top Property Sales Past 12 Months
1) Gateway Business Centre – 9300 28th St N
Rating: 3*
Year Built: 1997
Building SF: 197,504
Vacancy: 0%
Price (PSF): $32,100,000 ($163)
Cap Rate: Not Listed
2) National Distributing – 4901 Savarese Cir
Rating: 3*
Year Built: 1982
Building SF: 349,299
Vacancy: 0%
Price (PSF): $29,700,000 ($85)
Cap Rate: Not Listed
3) 2007 Gandy Blvd
Rating: 3*
Year Built: 2000
Building SF: 175,300
Vacancy: 81.7%
Price (PSF): $29,500,000 ($168)
Cap Rate: Not Listed
4) Airport Logistics Center – 4908 W Linebaugh Ave
Rating: 3*
Year Built: 2025
Building SF: 125,400
Vacancy: 39.9%
Price (PSF): $27,189,400 ($217)
Cap Rate: Not Listed
5) 2003 Gandy Blvd
Rating: 4*
Year Built: 1999
Building SF: 130,625
Vacancy: 0%
Price (PSF): $23,600,000($181)
Cap Rate: Not Listed
*Rating is 1-5, 5 being the best
Take a look at our featured commercial real estate properties in Central Florida, or contact the Bounat team to start your own property search for commercial real estate space in the region.
* Data is courtesy of CoStar Group Inc.