

Tampa Office Real Estate Activity Highlights 2024
The divergence in demand between the key submarkets of Westshore and Downtown Tampa and the broader market continues to widen. Over the past year, while the overall Tampa market has witnessed a decrease of -210,000 square feet in occupancy, the primary submarkets have seen a notable uptick of 175,000 square feet. This surge can be attributed to the abundance of high-quality 4 & 5-star buildings in these areas, which have not only attracted newcomers but also facilitated relocations within the market in recent years. Conversely, Tampa’s secondary submarkets are experiencing a flight of tenants, leading to prolonged vacancies. Notably, the Northeast Tampa submarket stands out with a decade-high vacancy rate of 16% and an average listing time of approximately 13 months.
Uncertainty in the office sector and stricter lending conditions have curtailed new office construction, necessitating significant pre-leasing for projects to commence. For example, Midtown East, a 430,000-square-foot building within Bromley’s mixed-use Midtown project, is already 75% pre-leased. The next significant office development slated to break ground is GaxWorx, a 115,000-square-foot building in Ybor City, currently 45% pre-leased to Grow Financial.
Despite relatively stable office vacancy rates hovering around 9.4% in Tampa, regional variations are significant, driven by factors like location and amenities. Westshore, for instance, has seen its vacancy rate drop by 100 basis points year over year to 12.5%, hitting a four-year low. In contrast, the Northeast Tampa submarket has experienced a 250 basis points increase in vacancy, reaching 16%.
Asking rent growth has slowed notably due to reduced pressure from new construction. While Tampa’s average office asking rent has increased by 2.6% to $30.00 per square foot, this growth rate is halved compared to the previous year. Rental rates diverge across submarkets, with Westshore and Downtown Tampa commanding over $36 per square foot, while secondary submarkets like Northeast Tampa and East Tampa see averages below $30 per square foot.
Looking ahead, the disparity in demand between Tampa’s primary and secondary submarkets is expected to persist. Premium, move-in-ready spaces are likely to be quickly leased, while other available spaces, regardless of price, may remain vacant, reflecting ongoing market dynamics.
You can view our commercial properties in Tampa and elsewhere in Central Florida to see what real estate assets are available for lease / sale.
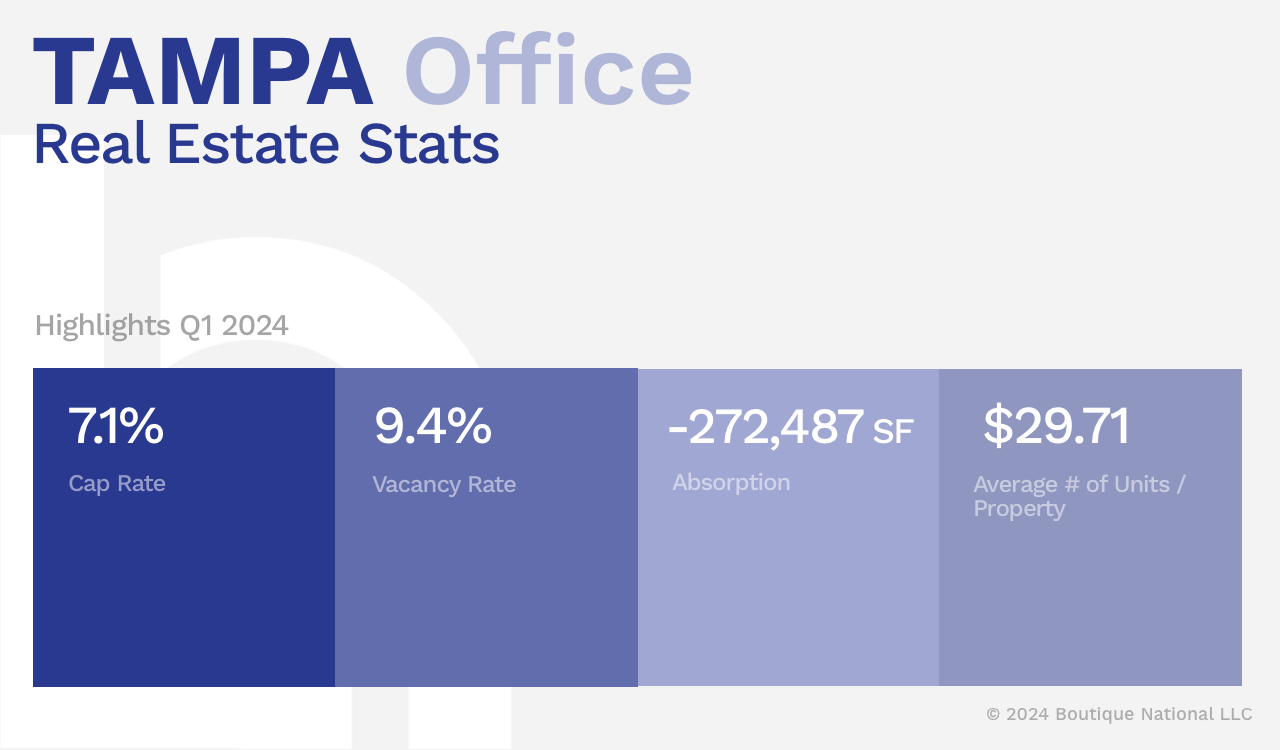
Tampa Office Real Estate Stats Highlights Q1 2024
Below are some key statistics for the office market in Tampa over the last quarter: cap rate, absorption, vacancy rate, and the current asking rate per square foot.
Cap Rate: 7.1%
Absorption: -272,487 SF
Vacancy Rate: 9.4%
Asking Rate / SF: $29.71
Tampa Office Real Estate Stats Overview – Last 12 Months
Over the last 12 months, the total deliveries of completed Tampa office real estate space is 276K square feet, while there has been an aggregated absorption of -204K square feet. The current vacancy rate of office space in the area is 9.4%, and the rental rate has grown 2.6% total during the same time. To give some context, Tampa’s office vacancy rate is below the national average of nearly 13% overall.
12 Month Deliveries (in SF): 276,000
12 Month Absorption (in SF): -204,000
Vacancy Rate: 9.4%
12 Month Rent Growth: 2.6%
Tampa Office Real Estate Sales Summary for Q1 2024
Office investment activity in Tampa has seen a notable slowdown in recent quarters. The trailing 12-month sales volume has dipped to $674 million, with the first quarter of 2024 witnessing a meager $150 million in transactions, contrasting sharply with the $325 million recorded in the same period of 2023. Moreover, these current investment levels fall well below the five-year average of $1.1 billion. Notably, the lion’s share of activity over the past year has been concentrated in the Westshore and East Tampa submarkets, jointly comprising 40% of the total transaction volume.
Investors, particularly institutional ones, are proceeding cautiously in the Tampa market. The absence of single-property trades exceeding $25 million since October 2023 underscores this trend, with only eight properties fetching over $5 million during this timeframe. The largest trade involved the sale of Regency Park North, a three-building portfolio, to New York-based private investment firm Taconic Capital for $35 million.
Cap rates have been on the rise, climbing by 30 basis points year over year to an average of around 8.9%. However, recent transactions have shown a shift in focus from the initial cap rate to the price per square foot, as buyers prioritize acquiring properties at a discount for value-add opportunities. Office sale prices have witnessed a decline over the past few years, now averaging $189 per square foot, down 6% from the peak of $201 per square foot in mid-2022. This downward trajectory is expected to persist, with the average sale price not anticipated to breach the $200 mark until 2029.
Many sellers have incurred losses on transactions in recent quarters, leading to an increasing willingness to provide financing to facilitate deals. For instance, CTO Realty sold Sabal Pavilion 1, a fully subleased building in East Tampa, in December 2023 for $22 million, marking a loss of nearly $5 million compared to its purchase price in August 2020. Additionally, CTO Realty extended a $15.4 million mortgage at a fixed interest rate of 7.5% to the buyer, Reva Companies, for a term of 179 days, as part of a strategic move to reduce legacy office exposure.
Tampa Florida Significant Office Property Sales for Q1 2024
Over the near term, office investment deals are expected to remain challenging to finalize due to several factors. A lack of motivation to put office assets on the market, except under extreme circumstances such as impending debt maturities, has led many sellers to delay listing their properties. Furthermore, disparities in pricing expectations between buyers and sellers persist, with many bids falling 5% to 15% below pricing guidance.
Here are the top office real estate sales statistics in Tampa, FL from a total of 456 sales comparables. The average cap rate of these sales was 7.1% with an average price per square foot of $210. The properties were sold with an average vacancy of 13.1%.
Sales Comparables: 456
Average Cap Rate: 7.1%
Average Price / SF: $210
Average Vacancy During Sale: 13.1%
Here are the Top 10 Tampa Office Property sales during the last 12 months:
1. 2 Urban Centre
Rating: 4*
Bldg SF: 270,639
Year Built: 1984
Vacancy: 20.0%
Sale Date: 5/12/2023
Price: $62,410,476
Price/SF: $231
2. 1 Urban Centre – 4830 W Kennedy Blvd
Rating: 4*
Bldg SF: 269,859
Year Built: 1984
Vacancy: 22.5%
Sale Date: 5/12/2023
Price: $60,589,524
Price/SF: $225
3. Regency Park North – 599 Lake Kathy Dr
Rating: 3*
Bldg SF: 58,210
Year Built: 2001
Vacancy: 100%
Sale Date: 3/14/2024
Price: $35,134,217
Price/SF: $604
4. One Clearwater Tower – 600 Cleveland St
Rating: 4*
Bldg SF: 144,346
Year Built: 1975
Vacancy: 28.2%
Sale Date: 4/1/2024
Price: $33,200,000
Price/SF: $230
5. Sabal Pavilion 1 – 3620 Queen Palm Dr
Rating: 4*
Bldg SF: 120,500
Year Built: 1998
Vacancy: 25.0%
Sale Date: 12/20/2023
Price: $22,000,000
Price/SF: $183
Office Space Under Construction in Tampa Q1 2024
Here are the top stats for office properties currently under construction in Tampa, FL. From the 35 properties under construction there is a total of 931,657 square feet being added to the market, which represents nearly 1% of the total market.
Total Properties Under Construction: 35
Total Square Feet Being Built: 931,657
% of Inventory Under Construction: 0.7%
Preleased: 81.5%
Here are the top office real estate assets under construction in the Tampa market.
1. Midtown East – 1 Midtown Pl
Rating: 5*
Building Sq Ft: 428,292
Stories: 18
Start: January 2023
Complete: January 2025
Developer: The Bromley Companies
Owner: Highwoods Properties Inc
2. CAE USA Headquarters – Air Cargo Rd
Rating: 5*
Building Sq Ft: 290,000
Stories: 3
Start: June 2022
Complete: November 2023
Owner: CAE USA
3. BayCare Medical Office- N Park Rd & E Sam Allen Rd
Rating: 3*
Building Sq Ft: 80,000
Stories: 6
Start: July 2021
Complete: June 2024
Developer: Not Listed
Owner: BayCare Health Systems, Inc
4. 16643 Fishhawk Blvd
Rating: 3*
Building Sq Ft: 10,075
Stories: 1
Start: Mar 2024
Complete: June 2024
Developer / Owner: Not Listed / Florida Kidney Physicians
5. 5087 Little Rd
Rating: 3*
Building Sq Ft: 9,340
Stories: 1
Start: January 2024
Complete: May 2024
Owner: Not Listed
Take a look at our featured Tampa office real estate spaces, or other Tampa commercial real estate properties here, or contact the Bounat team to start your own search for properties in the area.
* Data is courtesy of CoStar Group Inc.